Life Expectancy in US vs Global Trends: How America Compares from 1950 to 2050
Introduction
The term “global life expectancy in US” doesn’t just indicate how long Americans are expected to live — it provides deep insights into the country’s healthcare system, economic strength, social infrastructure, and overall quality of life. By comparing U.S. life expectancy trends to those of other global regions from 1950 to the projected figures for 2050, we gain a broader understanding of where the U.S. leads and where it lags behind.
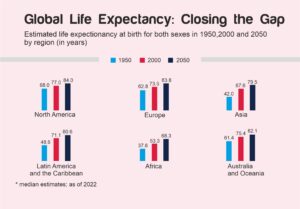
A recent visualization by Statista, based on data from the United Nations Population Division, presents a comprehensive view of global life expectancy trends over time. This article dives deep into the numbers, offering a region-by-region comparison while keeping the U.S. as the benchmark.
Life Expectancy in North America (Primarily the US)
- 1950: 68.0 years
- 2000: 77.0 years
- 2050 (projected): 84.0 years
The U.S. had one of the highest life expectancies in 1950. Medical advancements, better sanitation, vaccinations, and improved living conditions helped the country achieve a significant increase by 2000. By 2050, it’s projected to reach 84 years — a 16-year improvement over a century.
1. Europe
- 1950: 62.8 years
- 2000: 73.5 years
- 2050: 83.8 years
Catch-up trend: Europe started below the U.S. but has steadily closed the gap. Universal healthcare systems, social welfare programs, and preventive medicine have helped European nations nearly match U.S. projections for 2050.
2. Latin America and the Caribbean
- 1950: 48.6 years
- 2000: 71.1 years
- 2050: 80.6 years
Biggest leap: Latin America shows a staggering 32-year improvement between 1950 and 2050. Countries like Costa Rica and Chile now boast life expectancies that rival developed nations, due to focused investments in healthcare access, sanitation, and maternal care.
3. Asia
- 1950: 42.0 years
- 2000: 67.6 years
- 2050: 79.5 years
Rapid growth: From just 42 years in 1950, Asia is projected to reach nearly 80 years by 2050. Economic development, modern hospitals, tech-based healthcare solutions, and better education have all contributed to this dramatic rise.
4. Africa
- 1950: 37.6 years
- 2000: 53.3 years
- 2050: 68.3 years
Ongoing struggle: Despite being the lowest among regions, Africa has made meaningful progress, particularly through global health efforts, infectious disease control, and expanding access to essential health services. From 1950 to 2050, an increase of over 30 years is projected.
5. Australia and Oceania
- 1950: 61.4 years
- 2000: 75.4 years
- 2050: 82.1 years
Steady improvement: Oceania, driven by countries like Australia and New Zealand, shows consistent gains. Their strong public health systems, focus on wellness, and environmental quality contribute to near-parity with the U.S.
U.S. vs. Global Trend Overview
While the global life expectancy in US remains among the highest, the lead the country once had is diminishing.
From a 1950 comparison:
- U.S. led all other regions in life expectancy.
- Europe trailed by 5.2 years.
- Latin America and Asia lagged by 19.4 and 26 years respectively.
- Africa had a 30.4-year gap.
In the 2000 snapshot:
- Europe had nearly caught up (only 3.5 years behind).
- Asia and Latin America closed the gap to within 10 years.
- Africa remained behind but made notable gains.
By 2050 projections:
- Europe will nearly match the U.S.
- Latin America will be just 3.4 years behind.
- Oceania only 1.9 years behind.
- Asia within 4.5 years.
- Africa will still lag but gains a total of 30.7 years.
Key Drivers for U.S. Life Expectancy Trends
Positives:
- Advanced medical technology: Leading innovations in treatment and diagnostics.
- Specialized healthcare: Centers of excellence for complex diseases.
- Emergency response systems: Rapid trauma care and emergency interventions.
Negatives:
- Health disparities: Uneven access to care across races, geographies, and incomes.
- Chronic illnesses: High rates of obesity, diabetes, and hypertension.
- Mental health crisis: Suicide and substance abuse are major contributors to mid-life mortality.
- Gun violence: A leading cause of premature deaths, especially among young adults.
- Healthcare costs: High out-of-pocket expenses deter many from seeking preventive care.
What the US Can Learn from Other Regions
- Europe: Emphasize primary care, universal coverage, and early intervention.
- Latin America: Achieving much with limited resources shows the value of political will and strategic investment.
- Asia: Using technology to democratize access to healthcare.
- Africa: Global collaboration, grassroots mobilization, and community health programs can create tangible outcomes even in low-resource settings.
- Oceania: Holistic approach to health — blending physical, mental, and environmental health efforts.
Looking Ahead: What the Future Holds
By 2050, global life expectancy in US will still be one of the highest — but no longer by a large margin. The narrowing gap is not necessarily a sign of U.S. decline, but rather a testament to the global improvement in public health.
However, to maintain and improve its position, the U.S. will need to address structural issues:
- Reform healthcare access.
- Focus on preventive strategies.
- Reduce income inequality.
- Invest in public mental health.
- Create safer environments to reduce violent deaths and accidents.
Final Thoughts
The story of global life expectancy in US is one of both leadership and warning. From a top global position in 1950 to being nearly matched by other continents in 2050, the U.S. finds itself at a crossroads.
With the tools, resources, and innovation at its disposal, the U.S. still has the opportunity to lead the next era of health transformation — not just in years lived, but in healthy, fulfilling lives for all its citizens.
Source: Statista infographic based on UN Population Division, 2022 estimates